History Repeats Itself
You can't trade without Technical analysis
Believe and trade don't be scared and most especially don't be over confident because once your money is gone its gone.
Risk Reward Ratio
Personal risk profile depends on your age, responsibility, income, saving , Family status etc.
take only 2% risk of your investable capital
Technical Analysis is generally for trading
Technical analysis is study of stock price movement in order to make accurate decision what the market may do next
Every part of technical analysis is based on price
i.e. demand and supply.
Candle stick is simply the visual study of price itself
Even Indicators are based on the price
If you are looking for short term investment treading analysis is the best this you can take support of.
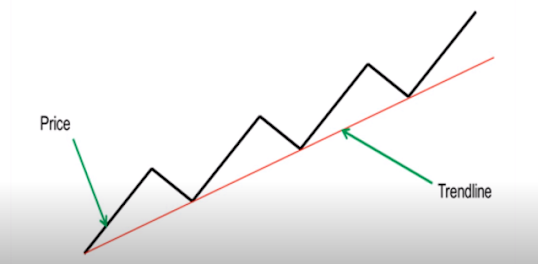
Trend Analysis
Bull and Bear
bull means up and bear means down
types of treads
- Up trend (Bullish trend)
- Down trend (Bearish trend)
- Sideways Trend
trend reversal means break out.
Breakout is simply the process of changing up trend into down trend or down to up trend
if future low(higher low) is greater than previous low than its called up trend
if future high(lower high) is lower than past high that it is called down trend.
side way trend is trend where price is slightly increase and slightly decrease alternatively resulting no profit and gain
For analysis of chart we can go to
or
or
or
or
Volume of trade is the total quantity of shares or contracts traded for specified securities
how to use volume to improve you trading
if there is high volume up or green line is bigger than buyers are aggressive
if there is high volume down or red line is bigger then seller are aggressive
low volume or low red or green line simply means quantity available are lower than average daily quantity
confused volume(low volume up) is algorithm where down side are happening
confused volume is an important indicator to show changes in trend or trend reversal
in normal volume are buying and selling are of same level the quantity of shares or trades is at an equilibrium so traders don't have any advantage or edge
6 important principle for candle stick analysis in trading
1. the length of any wick either to top or bottom of candle is always the first point of focus because it instantly show strength weakness and indecision and most important where smart money enter
2. If no wick or shadow is created then this signal strong market sentiments in the direction of closing price so smart money is active there
3. A wide body represents strong market sentiments and narrow body represent weak market sentiments
narrow body with long shadow or wick then money enter on the opposite direction
4. A candle of the same type will have a completely different meaning depending on where it appears in price trend
candle stick should analyze the context of the move
Always read the market phase by phase and then read the latest day's action into the phase
5. Volume validate price
6. When a particular time frame don't make sense, then move to the next higher time frame for the big picture or lower time frame for the microstructure of move
Treading candlestick with volume confirmation
volume is to identify interest level of institutional buyers
Price price to identify the direction of market
if current candle close is above the previous bullish candle close than its bullish pattern
like wise
if the current candle close is below the previous candle close then its not bullish pattern it is inside bar
Professional Tips
1. We can't move the market but every candle shows what smart money trying to shows
so their move trap or genuine is only validated by volume
2. Candle stick show half information another half information shows by volume
suppose 1st candle is big send candle
but there may be case that second volume bar is greater than 1st it becauseif the volume has represented buying how can the spread be narrow?
1. Either the institutional money is selling into the buying , possible reversal on near future
2. institutional money is prepared to absorb the selling from traders locked into this old trading range
breakout may happen
the above fig show sell signal
the candle is down closing at the top or middle
it shows that smart money testing supply and no more supply available
volume come in bullish gap than it result in strong bullish candle
volume is an important measure that can be used to identify as well as assess market strength and weakness
Learning how to identify volume trends is exciting especially if you are patient and devoted to be a fill time trader
With practice it can give a trader or investor a huge advantage
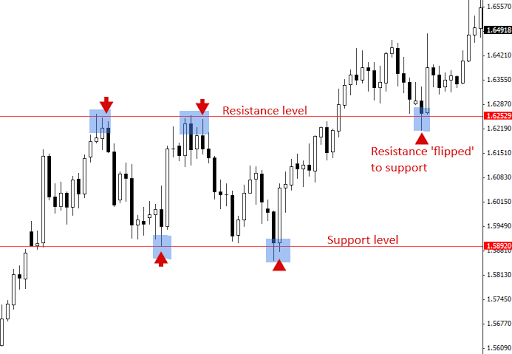
Support and Resistance
support and resistance is area in the market that price is likely to react from
support is area in market that price in market is likely to react from
support is area in market that price is likely to bounce up from or be supported by
where as resistance is an area in the market where price of asset or currency pair or crypto is likely to fall or drop down
Three main reason to use support and Resistance
- To spot possible reversal
- entry point on trail continuation trades
- to help us to determine stops and target
support and resistance my be horizontal or slanted
support tend to act as a floor by preventing the price of an asset from being pushed downward
support has buying pressure
lower low ,low and lower high form support
Resistance has selling pressure
generally higher high ,high and higher high form support
in resistance share price is very difficult to go up
In support and resistance before loop there should be 7-10 candle gap
Horizontal support
generally seen in sideway pattern
it indicate supply is less and demand is more
Horizontal resistance
it indicate demand is less and supply is more
minor resistance
strong resistance
major resistance
after major resistance there will be strong selling pressure so it goes to down trend
Trending support
It is in uptrend
if there is more than 3 treading support it result in strong bullish
trending resistance
if there is more then 3 trending resistance it result strong bearish
support becomes resistance and resistance becomes support
if support becomes resistance then its strong selling signal
Resistance becomes support
if resistance becomes support is is buy signal
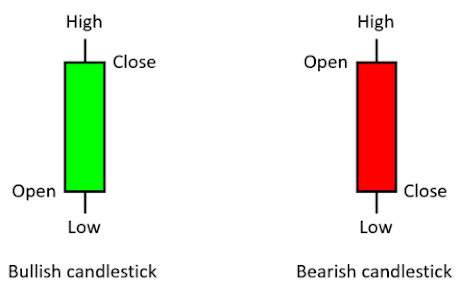
Candle Stick
IN candle stick horizontal thin line is shadow or wick and bulk part is body
Green candle is bullish candle where as red candle is bearish candle
to form candle there are 4 things
- Open Price
- Close Price
- Day's High
- Day's Low
if opening price is less than closing price it is bullish candle stick
if opening price is higher than closing price then it is bearish candlestick
Important types of candlesticks
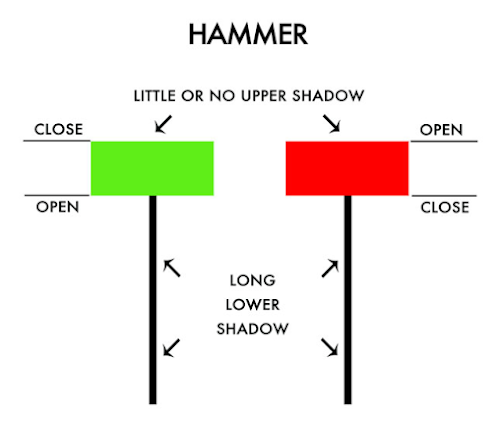
Hammer pattern
hammer is actually a buy signal
Open, close and high price are very very close
forms at the bottom of downtrend
lower shadow is 2 or times longer than body
Hammer is a strong evident for up trend as shown in figure below
Inverted Hammer
Potential direction is up i.e. bullish
so it indicate to buy
open close and low price are very close
forms at the bottom of downtrend
upper shadow is 2/3 times longer than body
bullish inverted hammer is better but bearish also does not matter
Hanging Man
Hanging is a sell signal
Criteria
Uptrend
Gap Up(may not be gap up as well with other date recent transaction)
lower shadow should be twice as big as real body
if Hanging man candle is red it is conform that market will go down
if hanging man candle is green we can conform with the help of other candle which is right side of the hanging candle
Shooting Star
It is selling signal
up trend
upper shadow at least twice as big as real body
Real body bullish or bearish better if bearish
shooting start if it appears during uptrend
Inverted Hammer if it appears during downtrend
DOJI PATTERN
Doji are of 4 type
four price doji
same open and same close is four price doji
it is straight horizontal line
no any meaning
DOJI STAR
common doji is actually a doji star
square shape
all side equal
Open and close very very close to each other
there are two types of doji star
morning doji star
Dogi is tread reversal or in decision
If dogi is formed after down tread then market will increase or it will be bullish
Evening doji star
Doji is actually tread reversal or in decision
if doji is formed after up tread then market will decrease or it will be bearish
Long legged doji
It denote mainly in decision
no any effect we wait for another candle
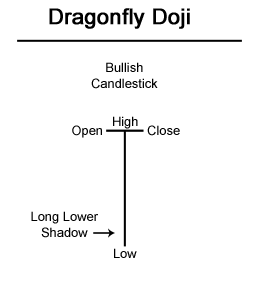
Dragonfly doji(T shaped doji)
it is strong tread reversal
downtrend
long lower shadow
small to or no upper shadow
close approximately the same as open
it goes to bull market if dragonfly doji comes after down trend
Gravestone Doji
We must sell if there is grave stone doji
It give strong signal for bearish market or market reversal
uptrend
long upper shadow
small to no lower shadow
close and open are close approximately
Marbozu candle
there are 2 type of marubozu candle bullish marubozu and bearish marubozu
marubuzu is a Japanese word for dominance
these are extremely powerful candles
they have a long body with small or no shadow
when a green marubozu candle is formed it means the stock opened at a certain level and kept rising without falling down
similarly a red marubozu is formed when the price opens a certain point and keeps falling
can be trend reversal or trend continuation candle
Engulfing candle(full)
there are 2 types of engulfing candle i.e. bullish engulfing and bearish engulfing
if bear candle is less than adjacent bull candle as whole then it will be bullish engulfing
bullish engulfing generally occurs in downtrend
bearish candle
gap down with adjacent candle
bullish candle should close above previous bearish candle
if bull candle is less then adjacent bearish candle as whole then it will be bearish candle
bearish engulfing generally occurs in uptrend
bullish candle
bigger bearish candle
then it will go to down tread
Morning star and Evening star
morning star show starting of bull trend
evening star show starting of bear trend
Morning star
bearish candle
gap down
small bearish / bullish as shown in fig (Day)
gap up
bullish candle
this result in up trend
Evening star
Criteria
uptrend
bullish candle
Gap up
small bullish/ bearish(star)
gap down
bearish candle
then the possible
MACD line
MACD stands for Moving Average Convergence and Divergence
MACD line is of blue color
signal line is of red color
histogram is of black color
MACD indicators
1. Cross over
2. Zero Cross
3. Pull Back
4. Bullish divergence
5. Bearish Divergence
if MACD line(blue line) cross Signal line(red line) from down to up then it is buy signal
if MACD line (blue line) cross signal line (red line ) from top top down then it is sell signal
Bullish divergence
we take two point price of bit long time interval more than few months
in such condition if the price is in down trend but if MACD is in uptrend then strong bearish will occur
Bearish divergence
we take two point price of bit long time interval more than few months
in such condition if the price is in up trend but if MACD is in downtrend
then in this case market will go to bear market
RSI(Relative Strength Index)
RSI is one of the most important indicator
RSI oscillate from 0 to 100
RSI = 100 - {100/(1+RS)}
where RS= Average gain/Average loss
0-50 is called bearish zone
50-100 is called bullish zone
70-100 is over brought
0-30 is oversold
we should sell we it is over brought i.e after 90
and buy if it is over sold after less than 20
if RSI is between 50-0
it may indicate Long Bearish Trend
likewise if RSI is between 50-100
it may indicate Long time bullish
if RSI is between 0-0 than
it indicate strong Bearish Trend
if RSI is between 70-100
then it indicate strong bullish
Bollinger's bands
bollinger band is an indicator as like MACD , RSI adx etc
IT as discovered by John bollinger in 1980.
band size or distance show volatility of market
middle band is simple moving average
upper and lower band is standard deviation
In normal volatile market if certain outbreak is in upper band than it will be bullish market
In normally volatile if there is certain outbreak in lower band than it will be bearish market
if mid band support the candle stick with upper band than its strong bullish trend
if mid band is like resistance with the candle stick to lower band than its strong bearish trend
There are different types of trading indicator, including leading indicators and lagging indicators. A leading indicator is a forecast signal that predicts future price movements, while a lagging indicator looks at past trends and indicates momentum.
Using MAs can be fundamental for technical analysis strategies, and using a combination of techniques can result in long and short-term forecasts. MAs can be calculated manually and used in any chart analysis simply by following the formula.
MAs can be used to determine levels of support and resistance. IG charts feature MAs, as well as other technical tools like Bollinger bands and relative strength index (RSI), in order to help traders with technical analysis. It can be used by clicking the ‘technical’ tab at the top of the chart.
It’s also important to note that there are two main types of MAs; exponential moving averages (EMA) and simple moving averages (SMA).
Exponential moving average
The EMA is calculated by placing greater weight on the most recent data points. It can sometimes be referred to as the exponentially 'weighted' moving average. This is because EMAs react significantly to the most recent price changes.
The most popular EMAs are 12 and 26-day EMAs for short-term averages, whereas the 50 and 200-day EMAs are used as long-term trend indicators. When used in conjunction with other indicators, EMAs can help traders confirm significant market moves and gauge their legitimacy.
Discounted cash flow
Discounted cash flow (DCF) is a valuation method used to estimate the value of an investment based on its expected future cash flows. DCF analysis attempts to figure out the value of an investment today, based on projections of how much money it will generate in the future. We can know the composite value with the help of discounted cash flow


 Criteria


Comments
Post a Comment